

What is BI and reporting, and what are their examples, best practices, and benefits? Moreover, you will know the real difference between business intelligence and business reporting. This guide provides the best advice to conduct business intelligence and reporting correctly. So let's get started!
Business Intelligence and Reporting
BI reporting uses the BI tool to analyze and prepare the data for finding and sharing active insights. So, BI reporting assists users in making better decisions and boosts business performance.
Business intelligence and reporting is a set of techniques and tools for transforming raw data into meaningful information for business analysis. You must be wondering how? BI reports present data and information in a clear, concise, and actionable format.
BI reporting analyzes and understands various aspects of a business, like financial performance, sales trends, customer behaviour, and operational efficiency. By analysing and visualising data, BI reporting helps companies identify patterns, trends, and opportunities.
Benefits Of Business Intelligence And Reporting
Some specific perks of BI reporting include:
- Providing a dashboard as a single source of truth for data and information across the organisation
- Facilitating data-driven decision-making by presenting data in a clear and actionable format
- Identifying trends and patterns in data that can inform business strategy and decision-making
- Allowing businesses to monitor key performance indicators (KPIs) and track progress towards goals
- Improving operational efficiency and productivity by identifying bottlenecks and areas for improvement.
- Before we head on to the bi-reporting examples, let's figure out the confusion between business intelligence and business reporting. BI and reporting are mostly used in an exchangeable way, but they aren't the same.
Business Reporting Vs. Business Intelligence
BI reporting denotes the procedure of presenting data and information in an organised manner; typically, it is a dashboard/report. It includes the presentation, analysis, and interpretation of it.
In comparison, business intelligence is a broader concept that entails reporting but entails the process and technology for gathering and analysing data to make deliberate business decisions.
Why Business Intelligence And Reporting Is In Demand By Enterprises Worldwide?
BI Reporting involves presenting that data clearly and concisely through dashboards, charts, and other visualisations. By using BI and reporting, organisations can gain valuable insights and make data-driven decisions that can improve performance and drive growth. BI and reporting tools are also becoming increasingly accessible and user-friendly, helping to drive their popularity. Let's see the kinds of business intelligence and reporting.
- Dashboards And Data Visualizations

Business intelligence (BI) dashboards are interactive visual displays of key performance indicators (KPIs) and other important data. They allow users to quickly and easily understand complex data and make data-driven decisions.
Data visualisation is the procedure of creating visual representations of data. It helps users understand and interpret data using charts, graphs, maps, and other visual elements. Data visualisation can be used in BI dashboards to make data more easily understandable and actionable.BI dashboards and visualisation is ideal for tracking and monitoring various business metrics, including sales, marketing, finance, operations, and customer service. They can also identify trends, track progress towards goals, and monitor key performance indicators.
BI dashboards can be accessed on desktop computers or mobile devices and are custom-made to meet different users' specific needs and preferences.
-
Mobile Business Intelligence (BI)

Mobile business intelligence (BI) uses mobile devices and tablets to access and interact with BI tools and applications. Mobile BI allows users to access and analyze business data in real-time, anywhere and anytime.
Some examples of mobile BI include
Dashboard: Apps allow users to view and interact with dashboards and charts on their mobile devices.
Reporting apps: Apps enable users to generate and view reports on their mobile devices.
Alerts and notifications: Mobile BI systems can send alerts and notifications to users' mobile devices to inform them of important events or changes in business data.
Collaboration and communication: Mobile BI systems can enable users to collaborate and communicate with each other in real-time, using features such as chat, messaging, and video conferencing.
Mobile BI can help organisations make better decisions, improve productivity, and increase competitiveness. - Self-Service Business Intelligence (BI)

Self-service business intelligence (BI) refers to BI systems and tools that enable users to access, analyze, and visualize data without needing technical expertise or assistance from IT staff.
Self-service BI systems typically provide a range of pre-built reports, dashboards, and tools for creating custom reports and dashboards. They also often include data visualisation tools, ad hoc querying, and analysis support.
Self-service BI allows users to get the data they need when they need it without having to wait for IT to create custom reports. With self-service BI, users can get the information they need without relying on IT to create custom reports, freeing up IT resources for other tasks. Plus, the users develop their data literacy skills and become more comfortable working with data.
Examples Of Business Intelligence Reports
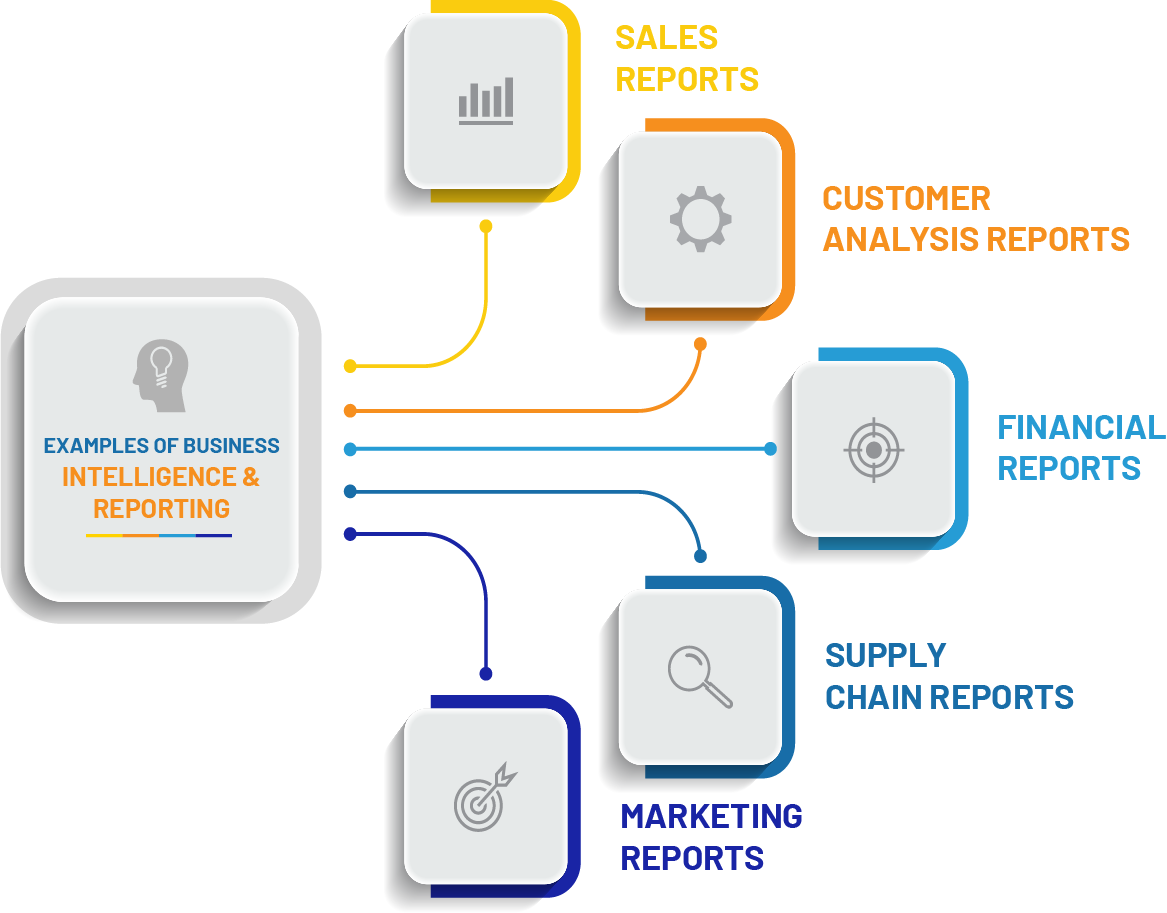
BI reporting can take many forms, including dashboards, charts, graphs, and tables that present data clearly and concisely. Here are some examples of BI reporting:
- Sales Reports:
These reports provide an overview of sales data, including sales volume, revenue, and profitability. They can help a business understand how well it performs and identify areas for improvement. - Customer Analysis Reports:
These reports provide insights into customer behaviour, including demographics, purchasing patterns, and loyalty. They can help a business understand its customer base and tailor marketing efforts accordingly. - Financial Reports:
These reports provide an overview of a business's financial health, including income statements, balance sheets, and cash flow statements. They can help a business understand its financial position and identify areas for improvement. - Supply Chain Reports:
These reports provide insights into a business's supply chain, including inventory levels, delivery times, and supplier performance. They can help a business optimise its supply chain and reduce costs. - Marketing Reports:
These reports provide insights into the effectiveness of marketing campaigns, including website traffic, social media engagement, and customer acquisition costs. They can help a business understand which marketing efforts are working and which are not.
BI & Reporting – Best Practices
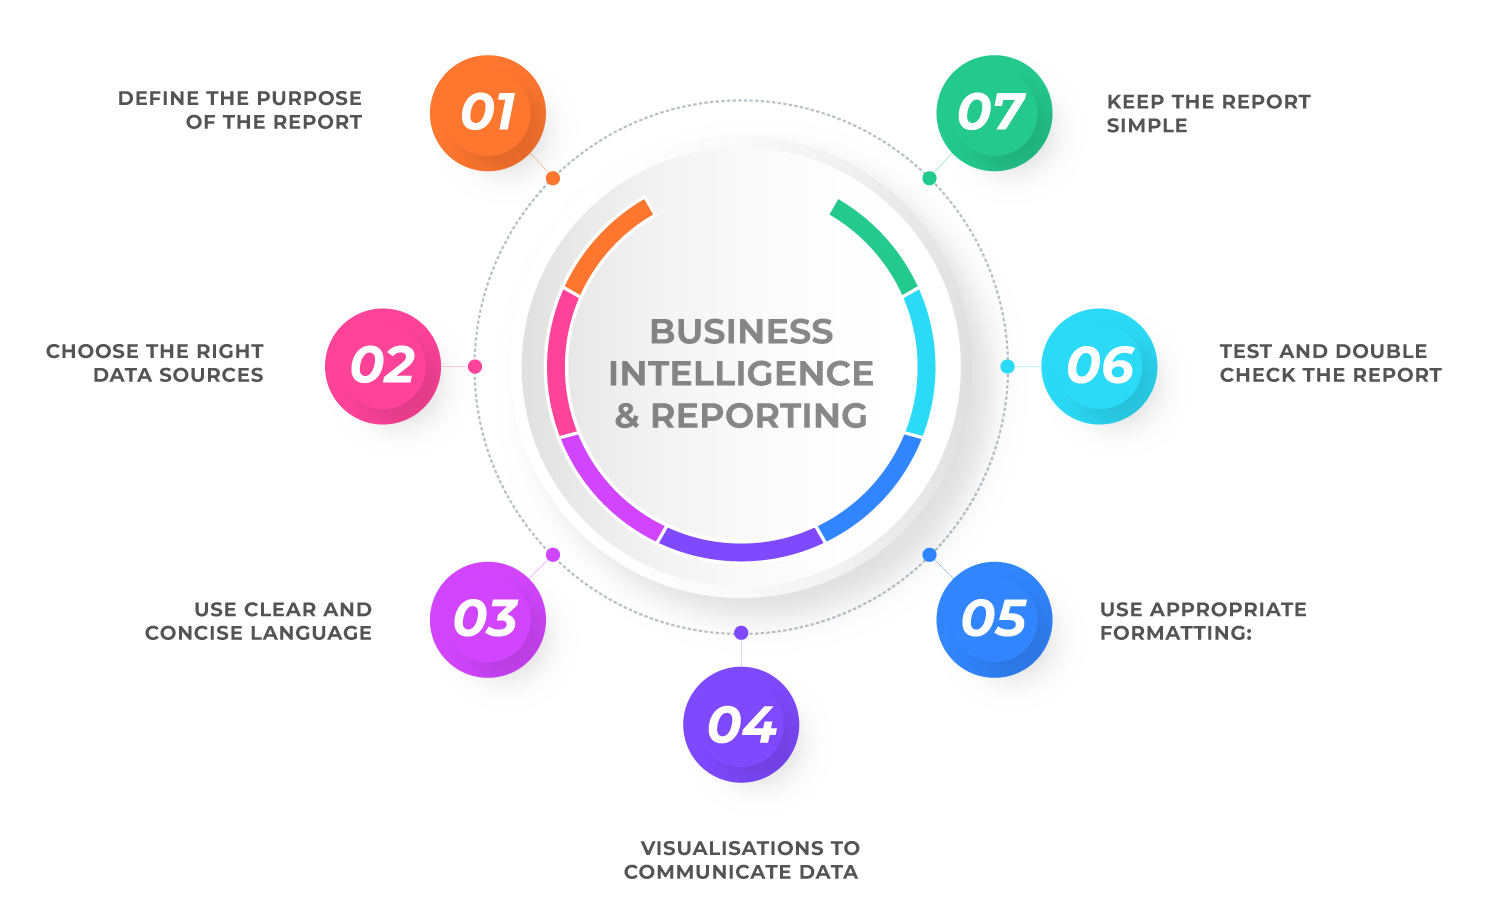
Several best practices you can follow when creating and presenting business intelligence and reporting:
- Define the purpose of the report:
Clearly define the report's purpose, including what you are trying to communicate and who the audience is. It will help you focus your efforts and create a relevant and useful report. - Choose the right data sources:
Choose data sources that are reliable and relevant to the purpose of the report. Ensure to clean and prepare the data before using it in your report. - Use clear and concise language:
You must use clear and concise language in your report to make it easy to understand. Avoid using technical jargon or acronyms that your audience may not know. - Visualisations to communicate data:
Use charts, graphs, and other visualisations to make it easier for the ease of your audience. Make sure to label the axes and include a legend, if necessary. - Use appropriate formatting:
Appropriate formatting is vital to make the report visually appealing and easy to read. Use titles, bullet points, and space to help the reader understand the report's main points. - Test and double-check the report:
Test the report with a small group of people to get feedback. Plus, make improvements before presenting it to a wider audience. - Keep the report simple:
Keep the report as simple as possible, focusing on the most important points and leaving out unnecessary details.
Following these best practices, you can create effective business intelligence and reporting that communicate your insights to the audience.
Why Choose Us For BI And Reporting?
BI software that fits your business can adapt to your requirements. One of the crucial features of business intelligence software is data analytics. The objectives of the business depict what kind of business analysis is suitable.
Various topmost software companies provide various business intelligence and reporting services worldwide. Some common ones include data analysis, dashboards, reports, data visualization, predictive analysis, and data warehousing. However, BT is distinguishable and unique for providing cloud services as we offer a range of BI services, tools, and technology. Our BI tools take the data of your enterprise resource planning software and provide real-time dashboards. We can help you to enhance inventory control, manage the supply chain, and automate tasks. With centralized data, you can identify issues, opportunities, and trends with the ability to showcase the underlying data for future insight.
Look no further if you need explicit BI and reporting services:
Services and Solutions:
- End-To-End Business Intelligence Implementation
- Business Intelligence Analysis And Solution Conceptualization
- Enterprise And Departmental Data Warehouse
Tools and Technologies
- Financial Reporting
- Predictive Analysis
- ETLProcessing
Managed Services
- Predictive Analysis
- Admin Support And Maintenance Services
- Qualitative And Quantitative Analysis
- Resource Outsourcing
- Self-Service And Ad-Hoc Business Intelligence Frameworks Development
Beaconhouse Technology offers all kinds of BI services. Best of all, you will be making better decisions for enhancing return on investment, so if you are having trouble handling your business and are new to BI reporting, no worries! We are here to serve you. To know more about our services or discuss with our experts, contact us at +92-42-111-232-888.
Read more about Business Intelligence and Reporting that will help you to plan the next big move!